close-up of Cobra Probe head Series 100 Cobra Probe ECA Probe Dynamic Pressure module Calibration traverse
  Turbulent Flow Instrumentation logo  
  Home Products Services Support Downloads Company  

Products

  • Cobra Probe
  • - Probes in use

    - references

  • DPMS
  • ECA Probe
  • Device Control
  • Other
  • FAQs
  • Cobra Probes in use

    The Cobra Probe was originally developed in the 1980's and has now been in use for some time. For publications about the Cobra Probe, or work carrried out using the Cobra Probe, go to the Cobra Probe references in the menu at left. Some examples of work using the Cobra Probe are given below (also see menu at right), and a review of some of the current uses for the Cobra Probe is given in Watkins, Mousley and Hooper (2002). Click on any image on this page to view a larger version.

    - Wind engineering BLs

    - Atmospheric turbulence

    - Airflow through radiators

    - Tunnel flow mapping

    - MAV aerodynamics

    Wind engineering boundary layers

    Wind engineering tunnels replicate the atmospheric boundary layer in a particular location in order to test scale models of buildings, bridges and other constructed facilities. With boundary layers of the order of hundreds of millimetres thick, spatial resolution (due to the relatively large size of the Probe head) is not an issue, and the Cobra Probe can be used to measure boundary layer properties. Using either manual or automatic traversing, the Device Control software's Flow Mapping module allows the taking of multiple measurements. This data can then be easily loaded into packages such as Excel®, for quick plotting of the time-averaged (mean) data (see images at right). Or alternatively, full time-history data can be examined if desired.

    Shown at right are a typical tunnel floor boundary layer and its associated turbulence intensity profiles from a large wind engineering facility. As with all Cobra Probe data, all three velocity components and static pressure are measured, thus allowing examination of the three-dimensional flow properties.

    A tunnel floor boundary layer profile as measured by the Cobra Probe

    The turbulence intensity measurements in the same boundary layer

    Atmospheric turbulence and vehicle interior noise

    The aim of this project was to link atmospheric winds to fluctuations of the sound field within a passenger vehicle.

    A Cobra Probe was mounted in a position forward of the test vehicle’s A-pillar and used to measure the time varying oncoming flow. The sound field in the vehicle was measured with a binaural, artificial head system.

    Analyses of data from the Cobra Probe and head system were performed and links found between the atmospheric fluctuations and the interior sound field (Mousley, Watkins & O'Shea 2001).

    The photo at right (courtesy of Peter Mousley) was taken during testing in the Monash University wind tunnel. Two Cobra Probes were being used simultaneously to correlate the flow upstream and downstream of the vehicle A-pillar; one Probe is visible attached to the side window while another has been fitted through the antenna socket just forward of the A-pillar.

    Vehicle with 2 Cobra Probes and a binaural head recording system in the Monash wind tunnel
    Flow through and around a car radiator

    Eton Ng investigated the flow through and around car radiators for his PhD thesis at RMIT University. The Cobra Probe was used to map the flow around a vehicle radiator and therefore validate a new pressure based technique for evaluating the flow through radiators during on-road testing (Ng, Watkins & Johnson 2004; Ng 2002). The images at right are courtesy of Eton Ng.

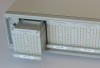
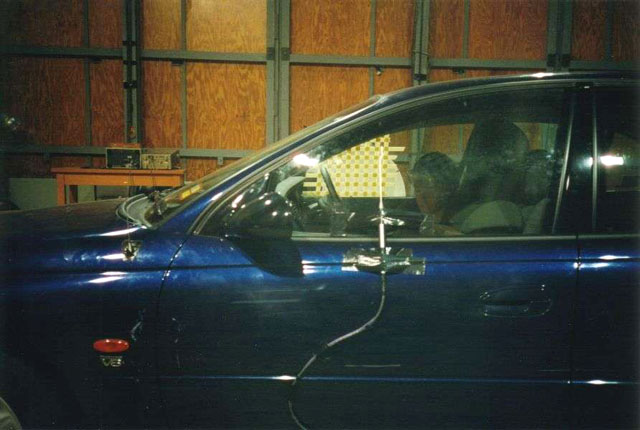
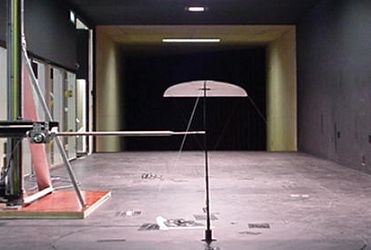
    In the image at right, a Cobra Probe is mounted on a 3-axis traverse (also built by TFI - see Other products). The wind tunnel working section is 300x300 mm and has a section of a radiator core filling the entire cross section.

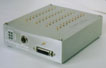
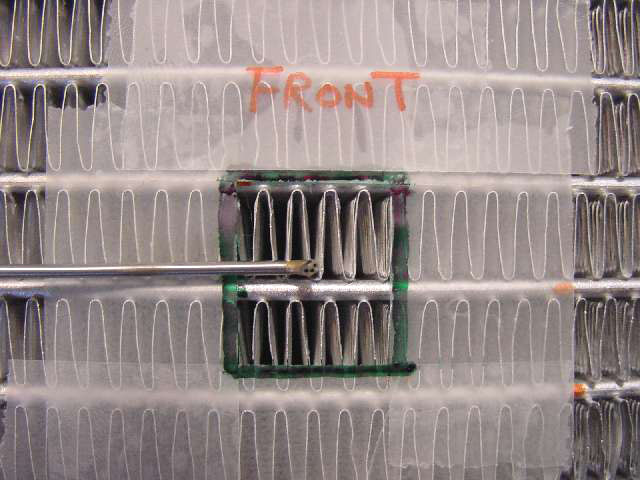
    The second image at right shows a Cobra Probe in front of a section of a car radiator core. The Probe in this picture features a head size of just 1.3 mm (each of the pressure taps in the Probe head are 0.25 mm diameter).

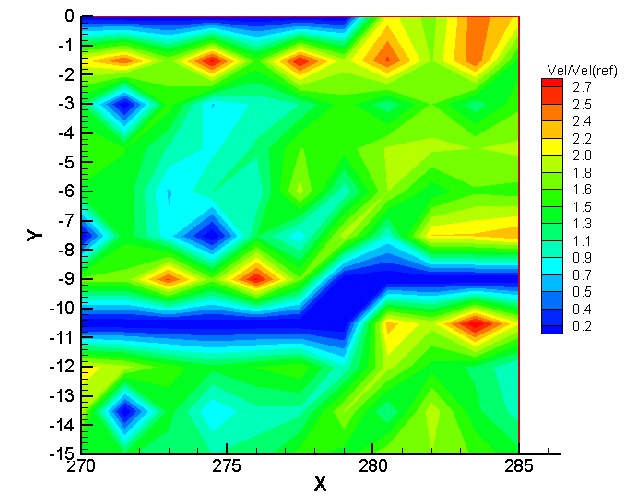
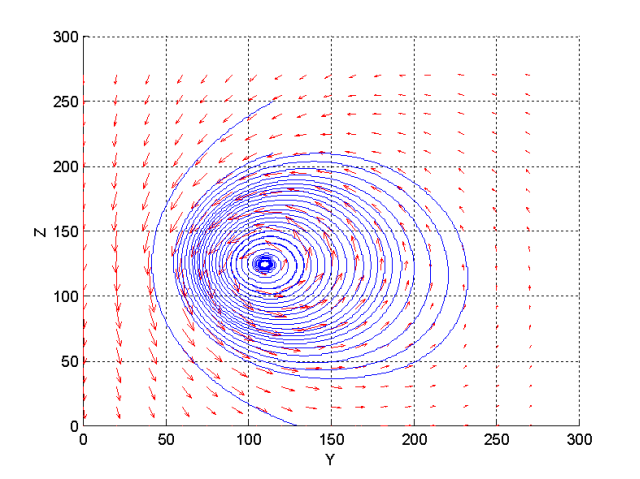
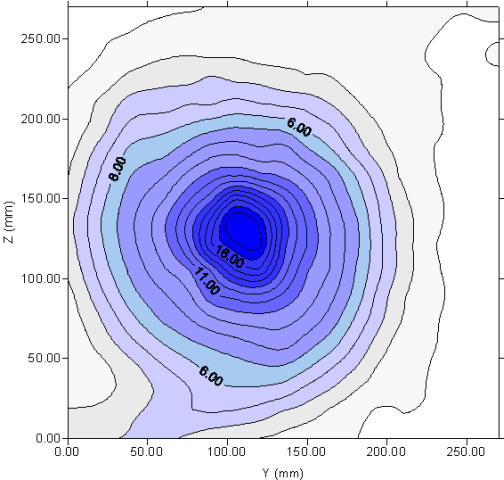
    The third and final image at right shows the velocity map obtained with the Cobra Probe flow-mapping module (contour plot created with TecPlot®). The map area corresponds to the section of radiator core surrounded with cello tape in the image above.

    The red areas correspond to the high-speed flow through the fins while the blue regions illustrate the wake of the fin separator. The latter is visible just below the Probe in the image above (the probe measurement grid was not quite level, which, combined with the coarse grid, is why there is a ‘step’ in the blue region).

    Traverse mounted Cobra Probe measuring the flow in front of a radiator mounted in a wind tunnel test section

    Small Cobra Probe head in front of the radiator core

    Velocity map produced from the Cobra Probe data

    Flow mapping wind tunnel flow

    As part of her PhD thesis at RMIT University, Juliette Milbank used the Cobra Probe to validate the flow of a recently constructed open-jet wind tunnel. The tunnel was constructed specifically for smooth flow at the jet exit and the Cobra Probe was therefore used to check that the flow met the desired design criteria (Milbank, Watkins & Kelso 2000). The image at right shows the tunnel jet exit (rectangular shape, 283 x 71 mm) with a flat plate model situated just downstream.

    The Flow Mapping module in the Device Control software was used in order to quickly and efficiently map several planes downstream of the tunnel jet exit. This was done in conjunction with an automated traverse (also built by TFI - see Other products). The mapped planes consisted of 29 x 27 point grids covering a 280 x 70 mm area at each downstream station, with the point density optimised to cope with the rapidly changing flow parameters at the edges of the jet. The resulting data was plotted using Tecplot®, as shown at right by the mean u-component velocity plots for three of the measurement planes. These plots show some typical characteristics of an open jet, that of increasing diffusion and dispersion of the jet with distance downstream of the jet exit (x-coordinate).

    The test section of an open-jet aeroacoustic wind tunnel, with a model in the tunnel jet

    Three measurement planes through an open jet taken using the Cobra Probe

    Micro Air Vehicle (MAV) Aerodynamics

    Research into the aerodynamics of MAVs is a growing area of interest, due to their usefulness for security and research applications. Associate Professor Simon Watkins (RMIT University) used a Cobra Probe to map parameters in the downstream vortex system of the wake of different MAV wing planforms, in order to examine conditions close to stall (Watkins 2003). Wake "maps" of cross-plane mean velocity, turbulence intensity and vw/U2 Reynolds stresses were generated, two of which are shown at right (images courtesy Assoc. Professor Watkins).

    The first plot at right shows the v- and w-components of velocity, (i.e. the lateral velocity components not in the streamwise direction), in the form of vectors and streamlines, 600 mm downstream of a particular MAV planform at a 23° angle of incidence. The freestream flow speed was 9.3 m/s. Measurements were taken at a resolution of ~15 mm, with a total grid size of ~640 measurement points. Initially measurements were taken across a complete plane behind the MAV, but once it was established that the flow was very symmetrical, further measurements were taken only on half planes (where Y = 0 is the axis of symmetry).

    The second plot at right shows the measured turbulence intensity (in %) as contours on the same half plane as that shown in the image above. All data was taken using a Series 100 Cobra Probe and the flow mapping module of the Device Control software, with the traverse also controlled by the software so that the measurements were completely automated.

    An MAV wing planform in the RMIT Industrial Wind Tunnel with a traverse mounted Cobra Probe

    Lateral velocity (v- and w-components)  on a half plane 600 mm downstream of the wing planform

    Turbulence intensity (streamwise)  on a half plane 600 mm downstream of the wing planform

    Home Products Services Support Downloads Company

    Copyright © Turbulent Flow Instrumentation Pty Ltd